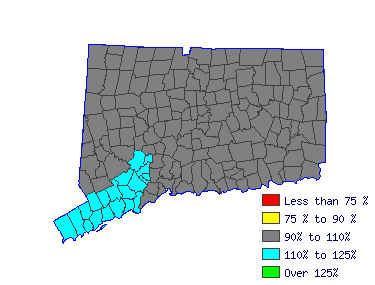
| South Central WDA (1Q 2016) |
| All Industry |
| Estimated employment | 670 |
| Mean wage | $122,236 |
| Entry wage | $88,915 |
| 10th percentile wage | $72,766 |
| 50th percentile wage | $128,504 |
| 90th percentile wage | $160,062 |
 | | Top Employing Industries |
| Industry | Employment / Percent |
| Education and Health Services | 650 | 98.2% |
 |
| Top Paying Industries |
| Industry | Employment / Median Wage |
| Education and Health Services | 650 | $129,185 |
 | |
 |
| Education Administrators, Elementary and Secondary School (11-9032) |
| Plan, direct, or coordinate the academic, clerical, or auxiliary activities of public or private elementary or secondary level schools. |
 |
| Mean Wage History |
| Year | This
Occupation | Compared to
Occupational Group | Difference |
| Current | $128504.04 | | $105346.66 |
| $23157.38 | | 2015 | $124055.43 | +3.6% | $101699.73 |
+3.6% | $22355.71 | | 2014 | $121123.40 | +2.4% | $99296.07 |
+2.4% | $21827.33 | | 2013 | $118191.36 | +2.5% | $96892.40 |
+2.5% | $21298.96 | | 2012 | $116270.37 | +1.7% | $95317.59 |
+1.7% | $20952.78 | | 2011 | $114450.49 | +1.6% | $93825.66 |
+1.6% | $20624.83 | | 2010 | $112023.98 | +2.2% | $91836.43 |
+2.2% | $20187.55 | | 2009 | $111215.14 | +.7% | $91173.35 |
+.7% | $20041.79 | | 2008 | $107777.58 | +3.2% | $88355.26 |
+3.2% | $19422.32 | | 2007 | $104238.92 | +3.4% | $85454.29 |
+3.4% | $18784.63 |
| Year | This
Occupation | Compared to
All Occupations | Difference |
| Current | $128504.04 | | $43353.41 |
| $85150.63 | | 2015 | $124055.43 | +3.6% | $42140.48 |
+2.9% | $81914.95 | | 2014 | $121123.40 | +2.4% | $41239.45 |
+2.2% | $79883.94 | | 2013 | $118191.36 | +2.5% | $40407.73 |
+2.1% | $77783.63 | | 2012 | $116270.37 | +1.7% | $39714.63 |
+1.7% | $76555.74 | | 2011 | $114450.49 | +1.6% | $39090.84 |
+1.6% | $75359.65 | | 2010 | $112023.98 | +2.2% | $38432.40 |
+1.7% | $73591.58 | | 2009 | $111215.14 | +.7% | $37912.57 |
+1.4% | $73302.57 | | 2008 | $107777.58 | +3.2% | $36942.23 |
+2.6% | $70835.35 | | 2007 | $104238.92 | +3.4% | $35763.96 |
+3.3% | $68474.95 |
 |
|
| Reference Date: 1st Quarter 2016 |
| Top Areas For This Occupation |
|
|
|

| |


